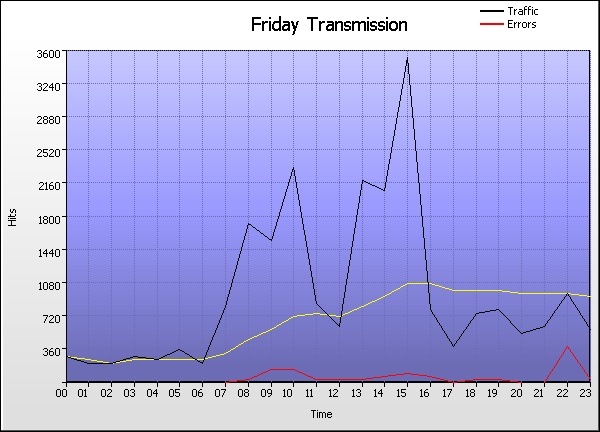
Time Graph
Go the Help Card.


Friday Transmission
  Time Hits % Bytes % Sessions Visitors Pages Errors
1 00:00 - 00:59
294    1.26%
0    0%
54,454 46,228 113 8
2 01:00 - 01:59
222    <1%
0    0%
61,251 43,602 114 12
3 02:00 - 02:59
228    <1%
0    0%
59,769 49,422 124 11
4 03:00 - 03:59
315    1.35%
0    0%
64,600 50,378 129 14
5 04:00 - 04:59
274    1.17%
0    0%
60,151 47,438 124 12
6 05:00 - 05:59
362    1.55%
0    0%
65,979 52,693 143 11
7 06:00 - 06:59
228    <1%
0    0%
66,082 49,943 119 16
8 07:00 - 07:59
850    3.64%
0    0%
69,855 53,090 162 12
9 08:00 - 08:59
1,738    7.43%
0    0%
84,595 65,701 263 56
10 09:00 - 09:59
1,567    6.70%
0    0%
77,316 61,724 327 162
11 10:00 - 10:59
2,361    10.1%
0    0%
63,425 47,428 215 174
12 11:00 - 11:59
897    3.84%
0    0%
64,156 44,260 180 38
13 12:00 - 12:59
615    2.63%
0    0%
67,863 53,769 151 58
14 13:00 - 13:59
2,217    9.48%
0    0%
75,485 59,668 260 52
15 14:00 - 14:59
2,114    9.04%
0    0%
77,447 65,808 257 89
16 15:00 - 15:59
3,562    15.2%
0    0%
88,708 75,177 342 120
17 16:00 - 16:59
795    3.40%
0    0%
79,872 60,198 156 90
18 17:00 - 17:59
409    1.75%
0    0%
67,798 52,630 162 23
19 18:00 - 18:59
772    3.30%
0    0%
81,387 62,366 213 54
20 19:00 - 19:59
794    3.40%
0    0%
78,569 59,246 265 70
21 20:00 - 20:59
555    2.37%
0    0%
63,490 51,966 140 28
22 21:00 - 21:59
647    2.77%
0    0%
69,120 55,189 169 28
23 22:00 - 22:59
980    4.19%
0    0%
65,628 51,804 520 411
24 23:00 - 23:59
581    2.49%
0    0%
76,998 59,239 153 46
  Average
974    4.17%
0    0%
70,166 54,956 200 66
24 Totals
23,377    100%
0    0%
30,461 2,962 4,801 1,595
Go the Help Card.

Help Card: Friday Transmission
Report Overview This report details the hour-by-hour breakdown of traffic generated on all Fridays. Use this information to assess the damage of unforeseen downtime, or to find key traffic spikes that could be used to influence special features or promotions.

This report may be affected by world time zones. Many webservers generate timestamps in Greenwich Mean Time (GMT+0), which may not be your local time zone. The time data in your logs can be adjusted to represent your local time zone, in Settings > Analysis > Options > Date range > Time adjust.

Graph Description Vertical axis: Hits (default sorting).
Number of hits to the site. Changing the sorting options in Settings > Statistics will alter the vertical axis to the new sort method (Visitors, Bytes, etc). This report may be sorted by hits, bytes, sessions, visitors, pages or errors.

Horizontal axis: Time
The hour of the day.

Red line (if present):
HTTP errors (Page not found, server error, etc)

Table Description Time:
The hourly period of the corresponding day.

Hits (%):
Number of hits to the site during the corresponding hourly period. (Percentage as a proportion of hits to the site during the day's 24 hours.)

Bytes (%):
Number of bytes transferred as a result of hits to the site during the corresponding hourly period. For readability, these values may be suffixed with kilobytes (KB), megabytes (MB) or gigabytes (GB), where applicable. (Percentage as a proportion of bytes transferred during the day's 24 hours.)

Sessions:
Total number of sessions undertaken during the corresponding hourly period. This number includes sessions undertaken by 'repeat' visitors.

Visitors:
Total number of unique visitors who undertook one or more sessions during the corresponding hourly period. Note that this figure represents a unique hourly visitor count, not a unique daily visitor count (as a unique visitor for one hour may return in another hour). As such, the "Totals" value will be cumulative for the 24 hours and the overall totals for individual days may appear higher than expected.

Pages
Number of pages viewed during the corresponding hourly period.

Errors
Number of server errors generated as a result of hits to the site during the corresponding hourly period.

Go back to the top.

Copyright © Quest Software , 1997-2002