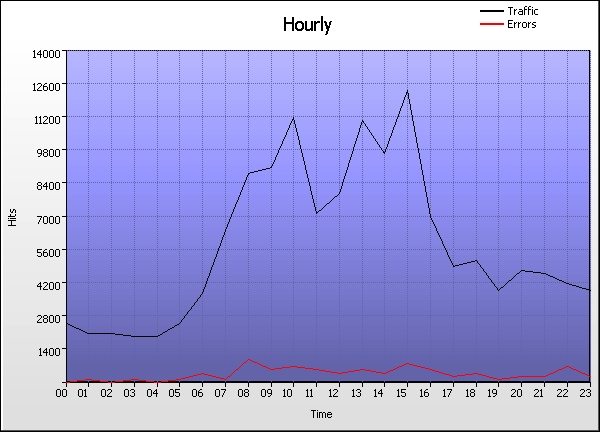
Time Graph
Go the Help Card.


Hourly
  Time Hits % Bytes % Sessions Visitors Pages Errors
1 00:00 - 00:59
2,561    1.82%
0    0%
425,762 344,049 974 126
2 01:00 - 01:59
2,194    1.56%
0    0%
394,389 312,049 998 185
3 02:00 - 02:59
2,151    1.53%
0    0%
434,179 351,526 1,077 121
4 03:00 - 03:59
2,041    1.45%
0    0%
443,710 341,235 1,058 150
5 04:00 - 04:59
2,091    1.48%
0    0%
415,367 321,336 1,053 138
6 05:00 - 05:59
2,589    1.84%
0    0%
436,019 342,955 1,078 159
7 06:00 - 06:59
3,892    2.76%
0    0%
440,702 352,510 1,458 538
8 07:00 - 07:59
6,540    4.64%
0    0%
472,490 374,119 1,277 192
9 08:00 - 08:59
8,933    6.34%
0    0%
523,166 411,934 2,371 993
10 09:00 - 09:59
9,226    6.54%
0    0%
477,794 387,621 1,734 609
11 10:00 - 10:59
11,252    7.98%
0    0%
484,598 380,280 1,564 776
12 11:00 - 11:59
7,155    5.07%
0    0%
473,186 364,790 1,381 588
13 12:00 - 12:59
8,049    5.71%
0    0%
499,949 388,503 1,598 496
14 13:00 - 13:59
11,061    7.84%
0    0%
504,452 399,243 2,005 578
15 14:00 - 14:59
9,735    6.90%
0    0%
522,898 414,392 1,782 490
16 15:00 - 15:59
12,458    8.83%
0    0%
528,713 429,592 1,825 849
17 16:00 - 16:59
7,071    5.01%
0    0%
497,572 397,232 1,715 573
18 17:00 - 17:59
5,022    3.56%
0    0%
474,294 373,081 1,242 356
19 18:00 - 18:59
5,220    3.70%
0    0%
479,135 378,607 1,358 467
20 19:00 - 19:59
3,931    2.79%
0    0%
468,104 371,848 1,307 275
21 20:00 - 20:59
4,809    3.41%
0    0%
469,676 372,100 1,660 365
22 21:00 - 21:59
4,725    3.35%
0    0%
527,606 438,481 1,200 347
23 22:00 - 22:59
4,339    3.08%
0    0%
469,493 374,159 1,533 715
24 23:00 - 23:59
3,964    2.81%
0    0%
491,748 384,216 1,101 319
  Average
5,875    4.17%
0    0%
473,125 375,244 1,431 433
24 Totals
141,009    100%
0    0%
30,461 2,962 34,349 10,405
Go the Help Card.

Help Card: Hourly
Report Overview This report provides a snapshot of traffic for each hour of the day. Use this information to find the most popular hours, which can be used to determine when system uptime is most crucial.

This report may be affected by world time zones. Many webservers generate timestamps in Greenwich Mean Time (GMT+0), which may not be your local time zone. The time data in your logs can be adjusted to represent your local time zone, in Settings > Analysis > Options > Date range > Time adjust.

Graph Description Vertical axis: Hits (default sorting).
Number of hits to the site. Changing the sorting options in Settings > Statistics will alter the vertical axis to the new sort method (Visitors, Bytes, etc). This report may be sorted by hits, bytes, sessions, visitors, pages or errors.

Horizontal axis: Time
The hourly periods of a day.

Red line (if present):
HTTP errors (Page not found, server error, etc)

Table Description Time:
The hourly period as the focus of this report.

Hits (%):
Number of hits to the site during the corresponding hourly period. (Percentage as a proportion of hits to the site during the day's 24 hours.)

Bytes (%):
Number of bytes transferred as a result of hits to the site during the corresponding hourly period. For readability, these values may be suffixed with kilobytes (KB), megabytes (MB) or gigabytes (GB), where applicable. (Percentage as a proportion of bytes transferred during the day's 24 hours.)

Sessions:
Total number of sessions undertaken during the corresponding hourly period. This number includes sessions undertaken by 'repeat' visitors. Note that he total of this column represents an overall session count for the entire period including those sessions overlapping hourly time periods. For this reason, the total of this column may appear smaller than the figure when adding up each row individually.

Visitors:
Total number of unique visitors who participated in sessions during the corresponding hourly period. Note that this figure represents a unique hourly visitor count, not a unique daily visitor count (as a unique visitor for one hour may return in another hour). As such, the "Totals" value will be cumulative for the 24 hours and the overall total for individual rows may be more than in the Totals row.

Pages:
Number of pages viewed during the corresponding hourly period.

Errors:
Number of server errors generated as a result of hits to the site during the corresponding hourly period.
Go back to the top.

Copyright © Quest Software , 1997-2002