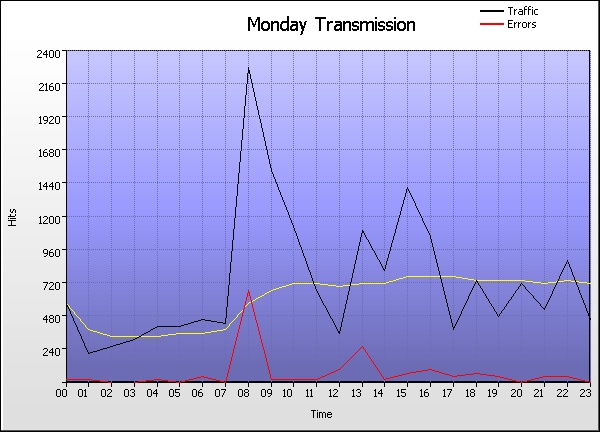
Time Graph
Go the Help Card.


Monday Transmission
  Time Hits % Bytes % Sessions Visitors Pages Errors
1 00:00 - 00:59
591    3.29%
0    0%
69,455 57,000 164 35
2 01:00 - 01:59
234    1.30%
0    0%
57,472 47,892 123 27
3 02:00 - 02:59
282    1.57%
0    0%
67,928 54,841 141 9
4 03:00 - 03:59
332    1.85%
0    0%
67,871 52,212 184 15
5 04:00 - 04:59
431    2.40%
0    0%
69,406 48,459 166 24
6 05:00 - 05:59
428    2.38%
0    0%
70,814 50,642 143 17
7 06:00 - 06:59
465    2.59%
0    0%
73,630 58,205 222 56
8 07:00 - 07:59
452    2.52%
0    0%
65,420 50,976 136 7
9 08:00 - 08:59
2,299    12.8%
0    0%
84,208 68,156 978 691
10 09:00 - 09:59
1,536    8.55%
0    0%
69,417 56,911 288 47
11 10:00 - 10:59
1,132    6.30%
0    0%
69,121 54,963 182 41
12 11:00 - 11:59
686    3.82%
0    0%
60,556 50,030 116 28
13 12:00 - 12:59
362    2.02%
0    0%
66,441 53,150 209 109
14 13:00 - 13:59
1,114    6.20%
0    0%
73,279 60,040 473 264
15 14:00 - 14:59
818    4.55%
0    0%
65,957 51,100 166 36
16 15:00 - 15:59
1,436    8.00%
0    0%
70,093 56,501 182 81
17 16:00 - 16:59
1,063    5.92%
0    0%
81,304 66,206 360 119
18 17:00 - 17:59
397    2.21%
0    0%
71,168 53,793 156 56
19 18:00 - 18:59
751    4.18%
0    0%
69,175 54,504 184 78
20 19:00 - 19:59
498    2.77%
0    0%
56,942 49,731 156 48
21 20:00 - 20:59
731    4.07%
0    0%
63,225 49,644 314 17
22 21:00 - 21:59
551    3.07%
0    0%
69,542 60,240 176 62
23 22:00 - 22:59
893    4.97%
0    0%
73,248 58,870 231 65
24 23:00 - 23:59
477    2.66%
0    0%
80,747 59,870 143 20
  Average
748    4.17%
0    0%
69,434 55,164 233 81
24 Totals
17,959    100%
0    0%
30,461 2,962 5,593 1,952
Go the Help Card.

Help Card: Monday Transmission
Report Overview This report details the hour-by-hour breakdown of traffic generated on all Mondays. Use this information to assess the damage of unforeseen downtime, or to find key traffic spikes that could be used to influence special features or promotions.

This report may be affected by world time zones. Many webservers generate timestamps in Greenwich Mean Time (GMT+0), which may not be your local time zone. The time data in your logs can be adjusted to represent your local time zone, in Settings > Analysis > Options > Date range > Time adjust.

Graph Description Vertical axis: Hits (default sorting).
Number of hits to the site. Changing the sorting options in Settings > Statistics will alter the vertical axis to the new sort method (Visitors, Bytes, etc). This report may be sorted by hits, bytes, sessions, visitors, pages or errors.

Horizontal axis: Time
The hour of the day.

Red line (if present):
HTTP errors (Page not found, server error, etc)

Table Description Time:
The hourly period of the corresponding day.

Hits (%):
Number of hits to the site during the corresponding hourly period. (Percentage as a proportion of hits to the site during the day's 24 hours.)

Bytes (%):
Number of bytes transferred as a result of hits to the site during the corresponding hourly period. For readability, these values may be suffixed with kilobytes (KB), megabytes (MB) or gigabytes (GB), where applicable. (Percentage as a proportion of bytes transferred during the day's 24 hours.)

Sessions:
Total number of sessions undertaken during the corresponding hourly period. This number includes sessions undertaken by 'repeat' visitors.

Visitors:
Total number of unique visitors who undertook one or more sessions during the corresponding hourly period. Note that this figure represents a unique hourly visitor count, not a unique daily visitor count (as a unique visitor for one hour may return in another hour). As such, the "Totals" value will be cumulative for the 24 hours and the overall totals for individual days may appear higher than expected.

Pages
Number of pages viewed during the corresponding hourly period.

Errors
Number of server errors generated as a result of hits to the site during the corresponding hourly period.

Go back to the top.

Copyright © Quest Software , 1997-2002