|
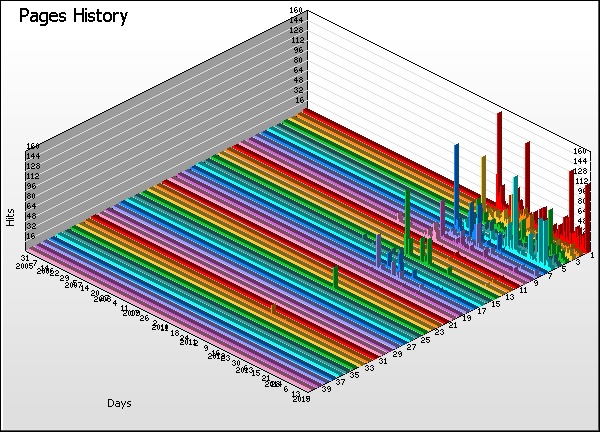
Pages History |
| |
Pages |
Hits |
% |
Bytes |
% |
Sessions |
Mean Time |
Visitors |
Errors |
|
1 |
/site-details.php |
|
|
3,384 |
01:03 |
1,007 |
21 |
|
2 |
/robots.txt |
|
|
5,196 |
00:42 |
1,231 |
210 |
|
3 |
/index.php |
|
|
3,913 |
00:26 |
1,448 |
97 |
|
4 |
/azoom.php |
|
|
1,859 |
00:47 |
483 |
0 |
|
5 |
/tzoom.php |
|
|
1,879 |
00:55 |
456 |
0 |
|
6 |
/downloadpdf.php |
|
|
1,357 |
00:46 |
506 |
7 |
|
7 |
/data/sites-show.php |
|
|
584 |
01:40 |
196 |
414 |
|
8 |
/blank.html |
|
|
863 |
00:31 |
613 |
0 |
|
9 |
/locations.php |
|
|
477 |
00:46 |
242 |
21 |
|
10 |
/ |
|
|
422 |
00:31 |
221 |
24 |
|
11 |
/education.html |
|
|
435 |
00:27 |
255 |
0 |
|
12 |
/pricing.html |
|
|
430 |
00:30 |
232 |
1 |
|
13 |
/about.html |
|
|
373 |
00:33 |
184 |
0 |
|
14 |
/data/sites-form.php |
|
|
82 |
04:29 |
8 |
3 |
|
15 |
/main.html |
|
|
322 |
00:25 |
197 |
0 |
|
16 |
/contacts.html |
|
|
312 |
00:17 |
160 |
0 |
|
17 |
/download.php |
|
|
99 |
01:50 |
86 |
0 |
|
18 |
/data/sites-handle.php |
|
|
67 |
01:38 |
9 |
3 |
|
19 |
/webreport/ |
|
|
125 |
00:48 |
25 |
63 |
|
20 |
/sites/1-a_img/zoomifyViewer.swf |
|
|
99 |
00:16 |
36 |
3 |
|
21 |
/sites/32-t_img/zoomifyViewer.swf |
|
|
84 |
00:50 |
26 |
5 |
|
22 |
/sites/20-t_img/zoomifyViewer.swf |
|
|
81 |
00:20 |
41 |
3 |
|
23 |
/sites/2-a_img/zoomifyViewer.swf |
|
|
80 |
00:38 |
30 |
0 |
|
24 |
/components/com_hotornot2/phpthumb/phpThumb.php |
|
|
26 |
01:30 |
20 |
78 |
|
25 |
/sites/9-a_img/zoomifyViewer.swf |
|
|
77 |
00:46 |
32 |
6 |
|
26 |
/sites/1-t_img/zoomifyViewer.swf |
|
|
74 |
00:41 |
35 |
0 |
|
27 |
/sites/2-t_img/zoomifyViewer.swf |
|
|
74 |
00:28 |
35 |
1 |
|
28 |
/sites/20-a_img/zoomifyViewer.swf |
|
|
71 |
00:29 |
33 |
3 |
|
29 |
/sites/12-t_img/zoomifyViewer.swf |
|
|
71 |
00:12 |
30 |
6 |
|
30 |
/sites/7-a_img/zoomifyViewer.swf |
|
|
71 |
00:35 |
23 |
6 |
|
31 |
/sites/10-a_img/zoomifyViewer.swf |
|
|
69 |
00:33 |
30 |
4 |
|
32 |
/Sites/southlouisiana.html |
|
|
39 |
00:59 |
37 |
68 |
|
33 |
/sites/28-a_img/zoomifyViewer.swf |
|
|
68 |
00:49 |
31 |
7 |
|
34 |
/sites/9-t_img/zoomifyViewer.swf |
|
|
67 |
00:41 |
27 |
6 |
|
35 |
/sites/35-t_img/zoomifyViewer.swf |
|
|
64 |
00:03 |
26 |
5 |
|
36 |
/sites/12-a_img/zoomifyViewer.swf |
|
|
64 |
00:35 |
27 |
7 |
|
37 |
/sites/4-t_img/zoomifyViewer.swf |
|
|
64 |
00:50 |
27 |
2 |
|
38 |
/sites/5-a_img/zoomifyViewer.swf |
|
|
63 |
00:25 |
23 |
1 |
|
39 |
/sites/5-t_img/zoomifyViewer.swf |
|
|
62 |
00:31 |
25 |
2 |
|
40 |
/sites/8-a_img/zoomifyViewer.swf |
|
|
59 |
00:34 |
25 |
2 |
| |
Subtotals |
|
|
23,606 |
294:33:04 |
8,178 |
1,079 |
|
915 |
Others |
|
|
4,702 |
50:18:10 |
3,542 |
3,818 |
| |
Average |
|
|
29 |
00:43 |
12 |
5 |
|
955 |
Totals |
|
|
28,308 |
344:51:14 |
11,720 |
4,897 |
|
|


