|
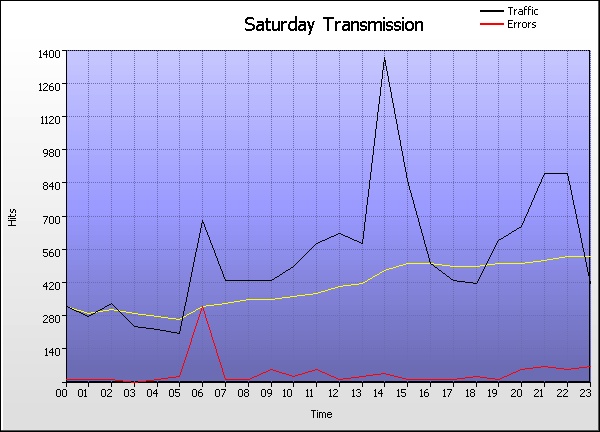
Saturday Transmission |
| |
Time |
Hits |
% |
Bytes |
% |
Sessions |
Visitors |
Pages |
Errors |
|
1 |
00:00 - 00:59 |
|
|
61,426 |
48,999 |
115 |
22 |
|
2 |
01:00 - 01:59 |
|
|
57,596 |
46,143 |
153 |
19 |
|
3 |
02:00 - 02:59 |
|
|
63,942 |
50,249 |
220 |
14 |
|
4 |
03:00 - 03:59 |
|
|
60,570 |
48,829 |
126 |
8 |
|
5 |
04:00 - 04:59 |
|
|
50,596 |
40,789 |
137 |
14 |
|
6 |
05:00 - 05:59 |
|
|
48,701 |
41,644 |
133 |
28 |
|
7 |
06:00 - 06:59 |
|
|
64,154 |
51,452 |
459 |
324 |
|
8 |
07:00 - 07:59 |
|
|
59,678 |
45,703 |
125 |
14 |
|
9 |
08:00 - 08:59 |
|
|
67,764 |
50,635 |
164 |
16 |
|
10 |
09:00 - 09:59 |
|
|
72,960 |
56,432 |
215 |
57 |
|
11 |
10:00 - 10:59 |
|
|
71,549 |
52,349 |
150 |
40 |
|
12 |
11:00 - 11:59 |
|
|
57,953 |
45,400 |
160 |
65 |
|
13 |
12:00 - 12:59 |
|
|
68,935 |
51,141 |
179 |
27 |
|
14 |
13:00 - 13:59 |
|
|
66,411 |
52,161 |
184 |
29 |
|
15 |
14:00 - 14:59 |
|
|
60,427 |
51,431 |
229 |
43 |
|
16 |
15:00 - 15:59 |
|
|
58,069 |
46,336 |
186 |
27 |
|
17 |
16:00 - 16:59 |
|
|
60,323 |
49,719 |
157 |
20 |
|
18 |
17:00 - 17:59 |
|
|
63,176 |
50,189 |
141 |
27 |
|
19 |
18:00 - 18:59 |
|
|
59,017 |
47,371 |
143 |
34 |
|
20 |
19:00 - 19:59 |
|
|
63,206 |
49,167 |
188 |
18 |
|
21 |
20:00 - 20:59 |
|
|
68,483 |
53,368 |
306 |
57 |
|
22 |
21:00 - 21:59 |
|
|
62,887 |
53,486 |
208 |
74 |
|
23 |
22:00 - 22:59 |
|
|
69,307 |
58,852 |
174 |
65 |
|
24 |
23:00 - 23:59 |
|
|
46,524 |
39,759 |
126 |
72 |
| |
Average |
|
|
61,818 |
49,233 |
182 |
46 |
|
24 |
Totals |
|
|
30,461 |
2,962 |
4,378 |
1,114 |
|
|