|
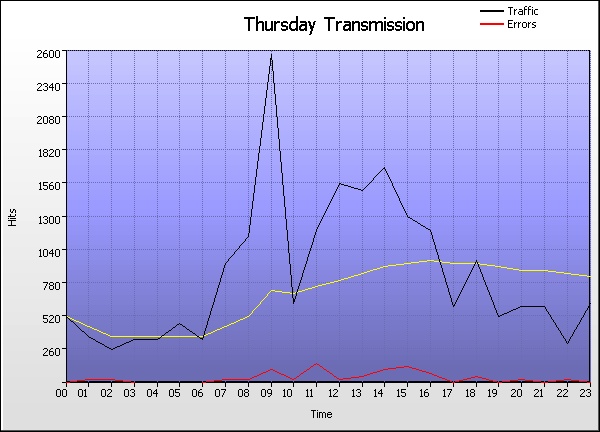
Thursday Transmission |
| |
Time |
Hits |
% |
Bytes |
% |
Sessions |
Visitors |
Pages |
Errors |
|
1 |
00:00 - 00:59 |
|
|
65,919 |
51,608 |
203 |
24 |
|
2 |
01:00 - 01:59 |
|
|
52,559 |
40,320 |
203 |
45 |
|
3 |
02:00 - 02:59 |
|
|
60,768 |
48,756 |
160 |
31 |
|
4 |
03:00 - 03:59 |
|
|
78,832 |
55,445 |
169 |
16 |
|
5 |
04:00 - 04:59 |
|
|
58,855 |
46,708 |
158 |
3 |
|
6 |
05:00 - 05:59 |
|
|
60,432 |
47,026 |
160 |
20 |
|
7 |
06:00 - 06:59 |
|
|
59,540 |
51,807 |
144 |
15 |
|
8 |
07:00 - 07:59 |
|
|
69,885 |
57,436 |
201 |
34 |
|
9 |
08:00 - 08:59 |
|
|
68,996 |
53,849 |
178 |
42 |
|
10 |
09:00 - 09:59 |
|
|
63,384 |
53,900 |
283 |
110 |
|
11 |
10:00 - 10:59 |
|
|
65,259 |
55,330 |
192 |
44 |
|
12 |
11:00 - 11:59 |
|
|
69,578 |
56,920 |
311 |
170 |
|
13 |
12:00 - 12:59 |
|
|
60,708 |
49,778 |
200 |
48 |
|
14 |
13:00 - 13:59 |
|
|
64,195 |
56,155 |
230 |
53 |
|
15 |
14:00 - 14:59 |
|
|
89,679 |
67,410 |
341 |
120 |
|
16 |
15:00 - 15:59 |
|
|
76,992 |
57,177 |
258 |
151 |
|
17 |
16:00 - 16:59 |
|
|
71,788 |
55,954 |
247 |
92 |
|
18 |
17:00 - 17:59 |
|
|
71,150 |
52,962 |
170 |
18 |
|
19 |
18:00 - 18:59 |
|
|
69,955 |
53,157 |
221 |
61 |
|
20 |
19:00 - 19:59 |
|
|
71,839 |
54,961 |
211 |
17 |
|
21 |
20:00 - 20:59 |
|
|
70,549 |
53,687 |
147 |
40 |
|
22 |
21:00 - 21:59 |
|
|
71,209 |
54,233 |
132 |
16 |
|
23 |
22:00 - 22:59 |
|
|
72,636 |
54,555 |
144 |
33 |
|
24 |
23:00 - 23:59 |
|
|
74,750 |
57,938 |
155 |
20 |
| |
Average |
|
|
68,310 |
53,628 |
200 |
50 |
|
24 |
Totals |
|
|
30,461 |
2,962 |
4,818 |
1,223 |
|
|