|
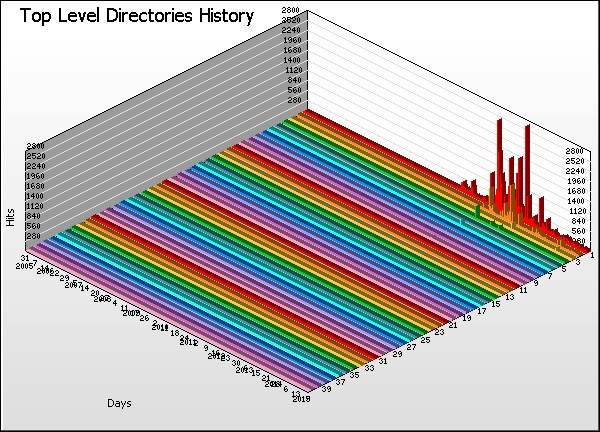
Top Level Directories History |
| |
Directory |
Hits |
% |
Bytes |
% |
Pages |
Errors |
|
1 |
/images/ |
|
|
1 |
1,307 |
|
2 |
/Sites/ |
|
|
3,172 |
3,711 |
|
3 |
/include/ |
|
|
30 |
981 |
|
4 |
/data/ |
|
|
1,647 |
422 |
|
5 |
/webreport/ |
|
|
255 |
63 |
|
6 |
/wp-content/ |
|
|
314 |
314 |
|
7 |
/admin/ |
|
|
181 |
184 |
|
8 |
/components/ |
|
|
157 |
157 |
|
9 |
/phpmyadmin/ |
|
|
74 |
74 |
|
10 |
/modules/ |
|
|
74 |
74 |
|
11 |
/web/ |
|
|
36 |
36 |
|
12 |
/php-my-admin/ |
|
|
31 |
31 |
|
13 |
/js/ |
|
|
29 |
31 |
|
14 |
/gallery/ |
|
|
30 |
30 |
|
15 |
/lib/ |
|
|
29 |
30 |
|
16 |
/cms/ |
|
|
29 |
29 |
|
17 |
/manager/ |
|
|
27 |
27 |
|
18 |
/common/ |
|
|
26 |
26 |
|
19 |
/zadmin/ |
|
|
26 |
26 |
|
20 |
/assets/ |
|
|
26 |
26 |
|
21 |
/class/ |
|
|
26 |
26 |
|
22 |
/content/ |
|
|
26 |
26 |
|
23 |
/staticfiles/ |
|
|
26 |
26 |
|
24 |
/pma/ |
|
|
26 |
26 |
|
25 |
/global/ |
|
|
26 |
26 |
|
26 |
/thumb/ |
|
|
26 |
26 |
|
27 |
/mambots/ |
|
|
26 |
26 |
|
28 |
/libs/ |
|
|
26 |
26 |
|
29 |
/phpThumb/ |
|
|
26 |
26 |
|
30 |
/mysqladmin/ |
|
|
24 |
24 |
|
31 |
/administrator/ |
|
|
24 |
24 |
|
32 |
/joomla/ |
|
|
23 |
23 |
|
33 |
/phpadmin/ |
|
|
22 |
22 |
|
34 |
/websql/ |
|
|
22 |
22 |
|
35 |
/myadmin/ |
|
|
20 |
20 |
|
36 |
/includes/ |
|
|
19 |
20 |
|
37 |
/phpmyadmin1/ |
|
|
19 |
19 |
|
38 |
/mysql/ |
|
|
19 |
19 |
|
39 |
/phpmyadmin2/ |
|
|
19 |
19 |
|
40 |
/phpMyAdmin-2/ |
|
|
18 |
18 |
| |
Subtotals |
|
|
6,657 |
8,043 |
|
430 |
Others |
|
|
1,495 |
1,512 |
| |
Average |
|
|
17 |
20 |
|
470 |
Totals |
|
|
8,152 |
9,555 |
|
|