|
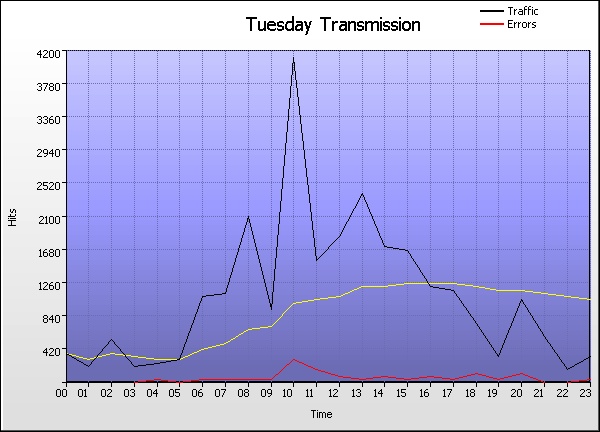
Tuesday Transmission |
| |
Time |
Hits |
% |
Bytes |
% |
Sessions |
Visitors |
Pages |
Errors |
|
1 |
00:00 - 00:59 |
|
|
57,847 |
47,721 |
144 |
16 |
|
2 |
01:00 - 01:59 |
|
|
61,015 |
49,050 |
120 |
14 |
|
3 |
02:00 - 02:59 |
|
|
60,498 |
50,813 |
142 |
27 |
|
4 |
03:00 - 03:59 |
|
|
54,313 |
41,049 |
111 |
21 |
|
5 |
04:00 - 04:59 |
|
|
49,878 |
40,571 |
164 |
53 |
|
6 |
05:00 - 05:59 |
|
|
62,348 |
49,926 |
157 |
16 |
|
7 |
06:00 - 06:59 |
|
|
59,603 |
49,635 |
191 |
55 |
|
8 |
07:00 - 07:59 |
|
|
65,691 |
54,039 |
206 |
55 |
|
9 |
08:00 - 08:59 |
|
|
74,107 |
62,211 |
329 |
42 |
|
10 |
09:00 - 09:59 |
|
|
64,895 |
55,732 |
233 |
73 |
|
11 |
10:00 - 10:59 |
|
|
74,225 |
61,929 |
412 |
294 |
|
12 |
11:00 - 11:59 |
|
|
69,529 |
57,996 |
266 |
209 |
|
13 |
12:00 - 12:59 |
|
|
74,772 |
59,822 |
266 |
100 |
|
14 |
13:00 - 13:59 |
|
|
72,220 |
57,349 |
253 |
67 |
|
15 |
14:00 - 14:59 |
|
|
77,995 |
63,490 |
310 |
96 |
|
16 |
15:00 - 15:59 |
|
|
74,752 |
61,978 |
230 |
80 |
|
17 |
16:00 - 16:59 |
|
|
63,354 |
50,853 |
187 |
84 |
|
18 |
17:00 - 17:59 |
|
|
63,351 |
51,896 |
181 |
45 |
|
19 |
18:00 - 18:59 |
|
|
65,500 |
54,574 |
288 |
162 |
|
20 |
19:00 - 19:59 |
|
|
51,833 |
44,900 |
158 |
55 |
|
21 |
20:00 - 20:59 |
|
|
61,042 |
53,091 |
416 |
159 |
|
22 |
21:00 - 21:59 |
|
|
114,043 |
105,185 |
160 |
38 |
|
23 |
22:00 - 22:59 |
|
|
50,760 |
41,673 |
90 |
13 |
|
24 |
23:00 - 23:59 |
|
|
53,443 |
47,052 |
171 |
66 |
| |
Average |
|
|
65,708 |
54,688 |
216 |
76 |
|
24 |
Totals |
|
|
30,461 |
2,962 |
5,185 |
1,840 |
|
|